
Refer to the figure below, and then answer the question that follows.
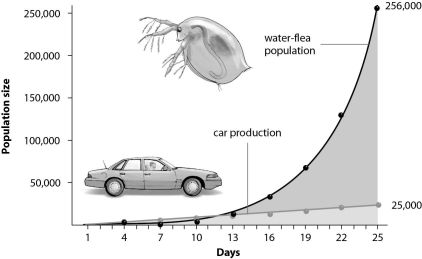
-What does the graph of Daphnia population growth suggest about this species?
A) The slow start suggests long generation time and a K-selected species.
B) The J-curve suggests short generation time and an r-selected species.
C) The straight line suggests a changing carrying capacity.
D) The high numbers suggest arithmetic increase.
Correct Answer:
Verified
Q66: Species with populations that are likely to
Q67: Why are K-selected species also known as
Q68: Evaluate why intrinsic rate of increase alone
Q69: What would be the "r" value or
Q70: Species that are introduced to new habitats,such
Q71: What is the total fertility rate number
Q72: Refer to the figure below, and then
Q74: Environmental pressures on a population,such as temperature
Q75: An "S" shaped curve would be indicative
Q76: Match the following.
Unlock this Answer For Free Now!
View this answer and more for free by performing one of the following actions

Scan the QR code to install the App and get 2 free unlocks

Unlock quizzes for free by uploading documents