Figure 1 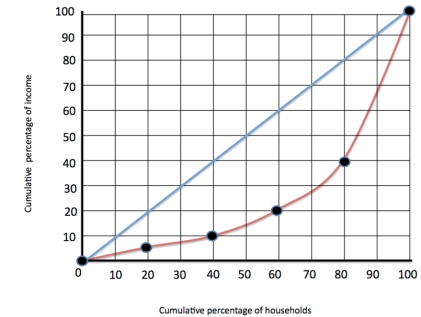
-Refer to figure 1. The red line refers to
A) The Gini coefficient
B) The Lorenz curve
C) The line of perfect inequality
D) The line of perfect equality
Correct Answer:
Verified
Q2: Figure 1 Q3: The distribution of income in the UK Q4: Figure 2 Q5: There is an easy and perfectly acceptable Q6: It is more efficient for the government Q8: A Gini coefficient of .7 suggests a Q9: When households are divided into deciles, each Q10: Utilitarianism is based on the assumption of Q11: The political philosophies of utilitarianism and liberalism Q12: Libertarians are more concerned with equal opportunity![]()
![]()
Unlock this Answer For Free Now!
View this answer and more for free by performing one of the following actions

Scan the QR code to install the App and get 2 free unlocks

Unlock quizzes for free by uploading documents