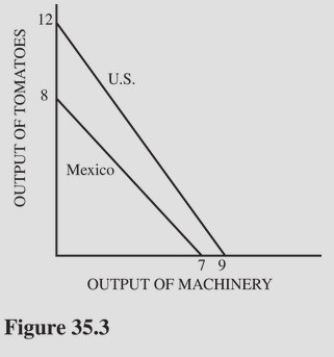
 Refer to Figure 35.3 for the production possibilities curves for the United States and Mexico.These two curves indicate that
A) The United States has a comparative advantage in the production of machinery.
B) Mexico has an absolute advantage in the production of machinery.
C) The United States has an absolute advantage in the production of both goods.
D) The United States does not have an absolute advantage in the production of either good.
Correct Answer:
Verified
Q68: To ensure mutually beneficial trade,the terms of
Q69: The amount of good A given up
Q70: Suppose Canada can produce either 300 tons
Q71: Q72: Assume Ireland can produce 4 units of Q74: Assume Saudi Arabia can produce 4 units Q75: With regard to international trade, Q76: Table 35.1 Q77: The terms of trade between two countries Q78: Unlock this Answer For Free Now! View this answer and more for free by performing one of the following actions Scan the QR code to install the App and get 2 free unlocks Unlock quizzes for free by uploading documents![]()
A)The production possibilities![]()

