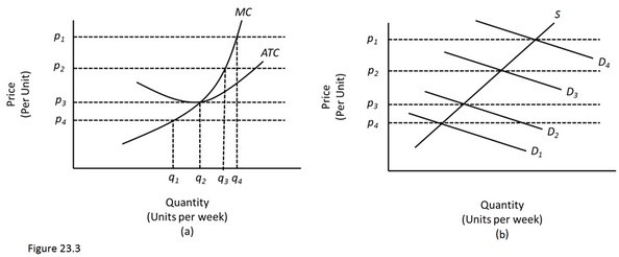
 In Figure 23.3,diagram "a" presents the cost curves that are relevant to a firm's production decision,and diagram "b" shows the market demand and supply curves for the market.Use both diagrams to answer the following question: In the long run,at prices below p3 in Figure 23.3,
A) There is economic profit.
B) The firm will produce the quantity where MC = MR.
C) Firms will enter the market.
D) Firms will exit the market.
Correct Answer:
Verified
Q90: High profits in a particular industry indicate
Q91: Barb's Soccer Ball Company produces 800 soccer
Q92: When an athletic shoe company is producing
Q93: Q94: When economic losses exist in the cereal Q96: In a perfectly competitive market economy,business failures Q97: In a perfectly competitive industry,economic profit Unlock this Answer For Free Now! View this answer and more for free by performing one of the following actions Scan the QR code to install the App and get 2 free unlocks Unlock quizzes for free by uploading documents![]()
A)Can persist

