Multiple Choice
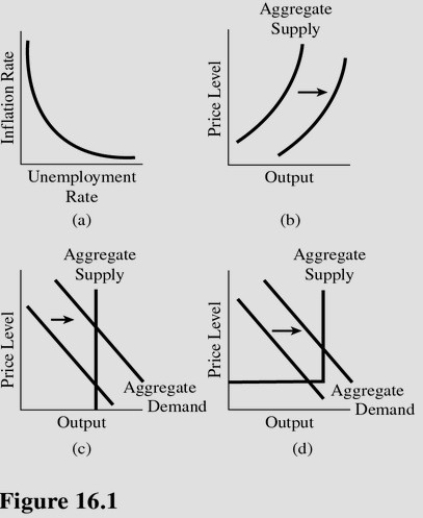 Choose the letter of the diagram in Figure 16.1 that represents the Phillips curve.
A) a.
B) b.
C) c.
D) d.
Correct Answer:
Verified
Related Questions
Q96: When the U.S.Congress increased the immigration quota
Q97: A reduction in tariffs and quotas on
Q98: According to supply-side economists,government regulation of factor
Q99: According to supply-side theory,which of the following
Q100: According to supply-side economists,federal regulation of transportation

