Multiple Choice
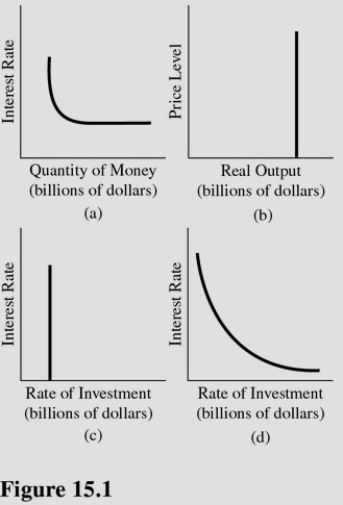 Which diagram in Figure 15.1 best represents a situation in which lower interest rates do not stimulate additional investment?
A) b and d.
B) b.
C) c.
D) d.
Correct Answer:
Verified
Related Questions
Which diagram in Figure 15.1 best represents a situation in which lower interest rates do not stimulate additional investment?
A) b and d.
B) b.
C) c.
D) d.
Correct Answer:
Verified

