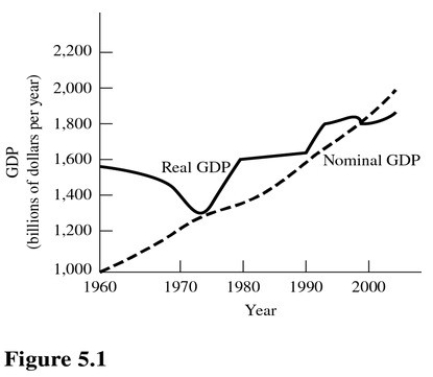
 In Figure 5.1,during the 1980-1990 time periods,real GDP was relatively constant but nominal GDP increased.This can be explained by
A) Lower average price levels.
B) Inflation.
C) Higher levels of production.
D) A decrease in production per capita.
Correct Answer:
Verified
Q36: The value of final output produced in
Q37: Suppose the total market value of all
Q38: To avoid counting the same output more
Q39: All of the following count as unreported
Q40: A furniture factory produces dining room sets.The
Q42: If the price level is 100 for
Q43: Depreciation represents
A)The consumption of capital in the
Q44: If real GDP in 2005 is $8,000
Q45: If nominal GDP was $11,500 billion in
Q46: ![]()
Unlock this Answer For Free Now!
View this answer and more for free by performing one of the following actions

Scan the QR code to install the App and get 2 free unlocks

Unlock quizzes for free by uploading documents