Multiple Choice
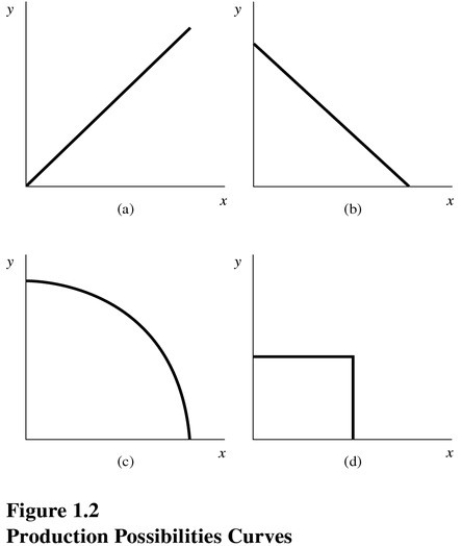 Choose the letter of the curve in Figure 1.2 that best represents a production possibilities curve for two goods for which there are constant opportunity costs:
A) A.
B) B.
C) C.
D) D.
Correct Answer:
Verified
Related Questions
Choose the letter of the curve in Figure 1.2 that best represents a production possibilities curve for two goods for which there are constant opportunity costs:
A) A.
B) B.
C) C.
D) D.
Correct Answer:
Verified

