Multiple Choice
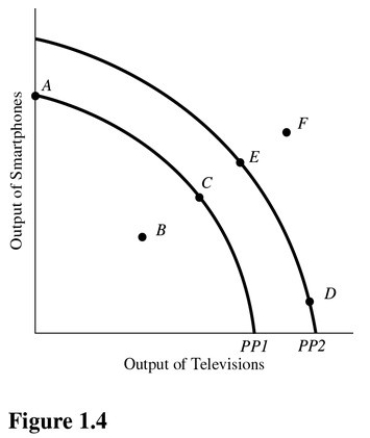 In Figure 1.4,a shift of the production possibilities curve from PP1 to PP2 could be caused by
A) An increase in the unemployment rate.
B) Implementation of training programs that improve the skills of workers.
C) A flu epidemic that makes many workers sick.
D) Tougher pollution controls for the producers of televisions and smartphones.
Correct Answer:
Verified
Related Questions

