Use the following figure to answer the questions : Figure 5.1 : 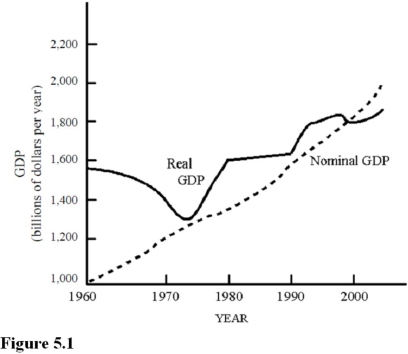 According to the hypothetical economy in
-during the 1980-1990 time periods,real GDP was relatively constant but nominal GDP increased.This can be explained by
A) Lower average price levels.
B) Inflation.
C) Higher levels of production.
D) A decrease in production per capita.
Correct Answer:
Verified
Q21: Suppose the total market value of all
Q37: Real GDP is the
A)Value of output produced,including
Q39: Value added is the
A)Addition to GDP because
Q40: A furniture factory produces dining room sets.The
Q41: The account that gives the most accurate
Q44: If the price level is 100 for
Q45: Use the following figure to answer the
Q47: Inflation is
A)The increase in the market value
Q48: An economy's production possibilities curve indicates
A)The rate
Q56: Net domestic product is
A)Equal to GDP minus
Unlock this Answer For Free Now!
View this answer and more for free by performing one of the following actions

Scan the QR code to install the App and get 2 free unlocks

Unlock quizzes for free by uploading documents