Use the following figure to answer the questions: Figure 1.6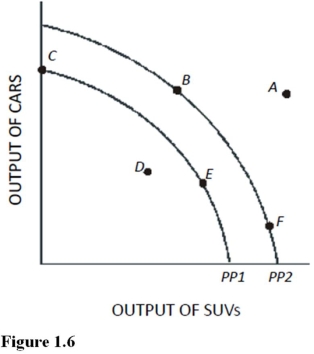
-If the opportunity cost of producing cars was zero at all levels of production,the production possibilities curve would be best be represented by a
A) Vertical line.
B) 45-degree line starting at the origin.
C) Horizontal line.
D) Circle.
Correct Answer:
Verified
Q72: Use the following figure to answer the
Q73: Table 1.2 shows the hypothetical trade-off between
Q74: Use the following figure to answer the
Q75: Use the following figure to answer the
Q76: Table 1.1 shows the hypothetical trade-off between
Q78: Use the following figure to answer the
Q79: Table 1.1 shows the hypothetical trade-off between
Q80: Table 1.1 shows the hypothetical trade-off between
Q81: Table 1.2 shows the hypothetical trade-off between
Q82: Table 1.3 shows the hypothetical trade-off between
Unlock this Answer For Free Now!
View this answer and more for free by performing one of the following actions

Scan the QR code to install the App and get 2 free unlocks

Unlock quizzes for free by uploading documents