The graph below is the Keeling Curve,a record of carbon dioxide measured at Mauna Loa beginning in 1958.What can be learned from this graph? What do the two lines (black and grey)tell us? 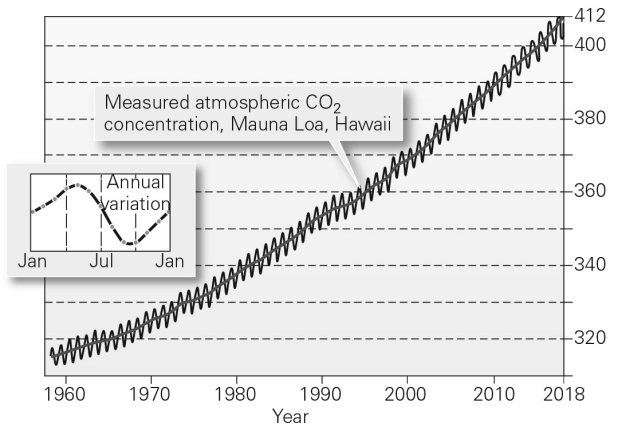
Correct Answer:
Verified
View Answer
Unlock this answer now
Get Access to more Verified Answers free of charge
Q36: The reliable paleoclimate record from the Antarctic
Q43: Describe one way humans have impacted the
Q50: How does our modern concentration of atmospheric
Q52: In the last few decades,global warming has
Q53: The figure below shows changes in sea
Q54: When did Vikings establish settlements in Iceland
Q54: Identify five probable outcomes of global climate
Q57: Discuss three lines of evidence that global
Q58: What is a biogeochemical cycle? Provide an
Q60: What role do greenhouse gases play in
Unlock this Answer For Free Now!
View this answer and more for free by performing one of the following actions

Scan the QR code to install the App and get 2 free unlocks

Unlock quizzes for free by uploading documents