The following graph shows the relationship between extinction and habitat area.Which statements help explain the trend shown on the graph? Check all that apply. 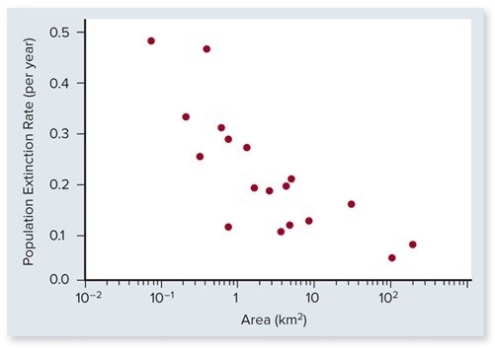
A) Larger patches are more likely to be encountered by new immigrants.
B) Larger patches are likely to have a more uniform habitat.
C) Larger patch size reduces genetic drift.
D) Larger patches are more geographically isolated than smaller patches.
E) Species richness is higher on larger patches.
Correct Answer:
Verified
Q1: Animals that weigh more than 100 pounds
Q2: Areas with high levels of endemism are
Q4: Match the correct case study in conservation
Q5: As we study the past 50,000 years
Q6: A friend asks you for a definition
Q7: Regarding megafaunal extinctions,it is assumed that the
Q8: The process of examining the genomes of
Q9: As many as one-half of Earth's plants
A)may
Q10: Edge effects are the result of which
Q11: Scientists speculate that extinctions did not occur
Unlock this Answer For Free Now!
View this answer and more for free by performing one of the following actions

Scan the QR code to install the App and get 2 free unlocks

Unlock quizzes for free by uploading documents