Which of the following is the best interpretation of the graph below of mussel size (x-axis) versus energy gain (line graph,left y-axis) ,and number of mussels eaten per day (histogram,right y-axis) ? 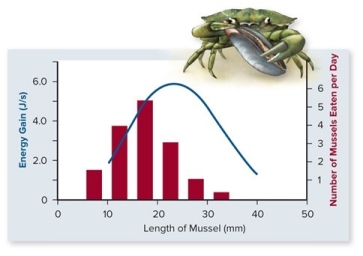
A) Mussels are selected as food sources by crabs.
B) Crabs select mussels in a way that maximizes their energy gain.
C) Mussel size does not seem to be a good predictor as to which mussel hungry crabs will select.
D) Crabs tend to consume most of the largest mussels.
E) Crabs prefer the mussels with the smallest length for their food resources.
Correct Answer:
Verified
Q55: The vertical dive of a moth for
Q56: It is 6:00 PM and the sun
Q57: Which of the following are examples of
Q58: Which of the following statements comparing the
Q59: You place an empty dog-food dish across
Q61: Choose the letter of the best match
Q62: You are on the committee to update
Q63: Which of the studies below provide evidence
Q64: In its youth,a pet parrot was owned
Q65: A bird sanctuary sometimes takes over the
Unlock this Answer For Free Now!
View this answer and more for free by performing one of the following actions

Scan the QR code to install the App and get 2 free unlocks

Unlock quizzes for free by uploading documents