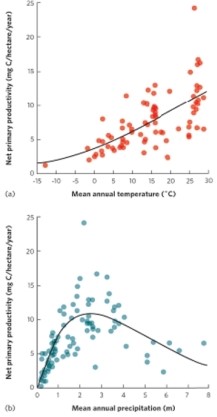
 (Figure 20.9) The figure shows that as mean annual temperature increases, net primary productivity also increases. Net primary productivity increases with mean annual precipitation until approximately 3 meters of precipitation, after which productivity declines. Why does this decline occur?
Correct Answer:
Verified
Q32: A terrestrial ecosystem has an NPP of
Q33: What nutrient fertilization has been discussed as
Q34: In addition to nitrogen and phosphorus, what
Q35: NPP varies with _ around the world.
A)
Q36: Compilation of data from many experiments on
Q38: What is the primary reason that estuaries
Q39: In fertilization experiments in a lake in
Q40: Silicon is used primarily by
A) zooxanthellae.
B) zooplankton.
C)
Q41: What accounts for the pyramid shape of
Q42: The study of the balance of nutrients
Unlock this Answer For Free Now!
View this answer and more for free by performing one of the following actions

Scan the QR code to install the App and get 2 free unlocks

Unlock quizzes for free by uploading documents