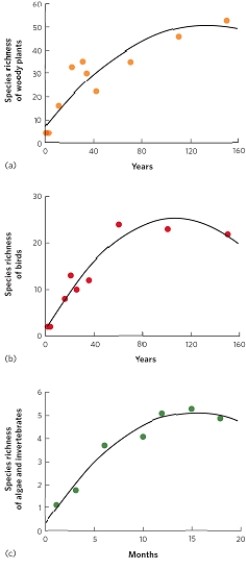
 (Figure 19.11) These graphs show that succession is associated with a rapid increase in species richness that slows and levels off over time. How might you explain a graph showing succession with an initial increase in species richness followed by a decline in species richness over time?
A) a disturbance such as fire
B) facilitation
C) inhibition
D) tolerance
Correct Answer:
Verified
Q48: Typical colonizers in primary succession are mosses
Q49: Late-succession species are likely to have
A) wind-dispersed
Q50: Researchers studying succession in three forest
Q51: Jaccard's index quantifies
A) similarity between communities.
B) differences
Q52: Early-succession species are likely to have
A) wind-dispersed
Q54: When seeds of early- and late-succession species
Q55: Which of the following is TRUE about
Q56: The assumptions behind the valid use of
Q57: Why do plants in early seral stages
Q58: Why are there no spruces in the
Unlock this Answer For Free Now!
View this answer and more for free by performing one of the following actions

Scan the QR code to install the App and get 2 free unlocks

Unlock quizzes for free by uploading documents