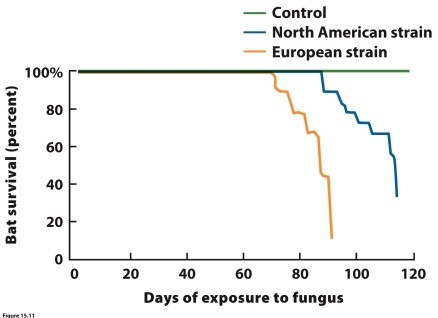
 The graph shows survival rates for North American populations of the little brown bat (Myotis lucifugus) after exposure to either a North American or European strain of white-nose fungus (Geomyces destructans). What did researchers conclude about the two strains?
Correct Answer:
Verified
Q9: Infection tolerance is the ability of a
Q10: Which of the following in NOT an
Q11: Malaria in humans and animals is caused
Q12: Which of the following statements is NOT
Q13: What types of endoparasites replicate by altering
Q15: Why does the parasitic flatworm (Leucochloridium paradoxum)
Q16: When a new disease is discovered, it
Q17: A parasite moving between individuals other than
Q18: The number of parasites of a given
Q19: The World Health Organization estimates that more
Unlock this Answer For Free Now!
View this answer and more for free by performing one of the following actions

Scan the QR code to install the App and get 2 free unlocks

Unlock quizzes for free by uploading documents