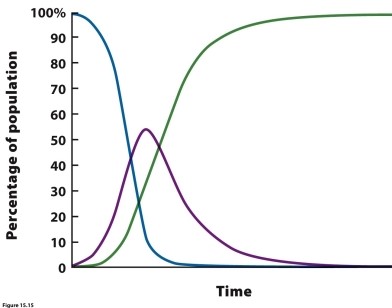
 In the figure showing dynamics of an infected population over time, what do the blue, purple, and green curves represent?
Correct Answer:
Verified
Q49: The amphibian pathogen the chytrid fungus does
Q50: Viruses and prions are both intracellular endoparasites.
Q51: Q52: Which of the following is NOT an Q53: Mice infected with Toxoplasma gondii are often Q55: According to an S-I-R model, if a Q56: Which species is a reservoir for Borrelia Q57: Chimpanzees infected with intestinal worms sometimes eat Q58: The parasitic worm Acanthocephalus dirus has evolved Q59: Vaccinations slow or stop the spread of![]()
Unlock this Answer For Free Now!
View this answer and more for free by performing one of the following actions

Scan the QR code to install the App and get 2 free unlocks

Unlock quizzes for free by uploading documents