The figure shows the change in population size of Paramecium from Gause's experiment, raised in either high-food or low-food conditions. Based on this figure, how was the logistic growth model for Paramecium changed by adding food? 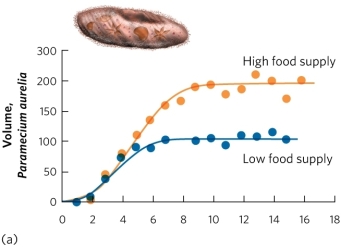
A) High food increased r.
B) High food decreased r.
C) High food increased K.
D) High food decreased K.
Correct Answer:
Verified
Q20: Q21: Consider a biologist who is studying a Q22: The logistic growth model describes a maximum Q23: In the logistic growth model, which term Q24: Which form of population growth results in Q26: In the logistic growth model, which term Q27: Which of the following statements about the Q28: A biologist grew 10 groups of flowers Q29: In the logistic growth model, under Q30: Which factors could limit a species' carrying![]()
Unlock this Answer For Free Now!
View this answer and more for free by performing one of the following actions

Scan the QR code to install the App and get 2 free unlocks

Unlock quizzes for free by uploading documents