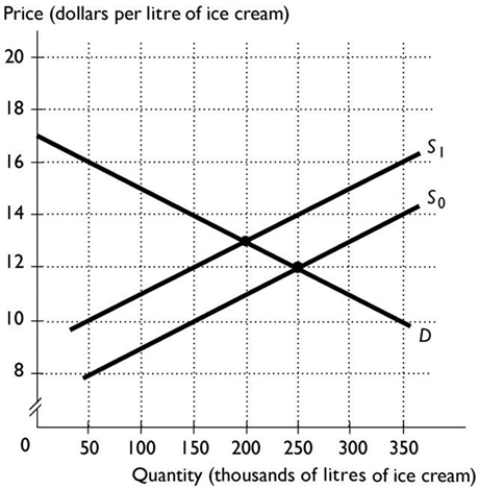
-The above figure shows the market for gourmet ice cream. In an effort to reduce obesity, the government places a $2 tax per litre on suppliers in this market, shifting the supply curve from S0 to S1. The quantity of ice cream consumed before the tax is ________ litres and the quantity consumed after the tax is ________ litres.
A) 200,000; 300,000
B) 300,000; 200,000
C) 250,000; 200,000
D) 200,000; 250,000
E) 200,000; 200,000
Correct Answer:
Verified
Q14: Q15: Q16: Tax incidence is the Q17: The demand for insulin is quite inelastic. Q18: Neither the demand nor the supply of Q20: If a tax is placed on suppliers Q21: Why do sellers pay all of a Q22: If buyers pay more of a tax Q23: The deadweight loss of a tax Q74: Unlock this Answer For Free Now! View this answer and more for free by performing one of the following actions Scan the QR code to install the App and get 2 free unlocks Unlock quizzes for free by uploading documents![]()
![]()
A) division of the
A) is![]()

