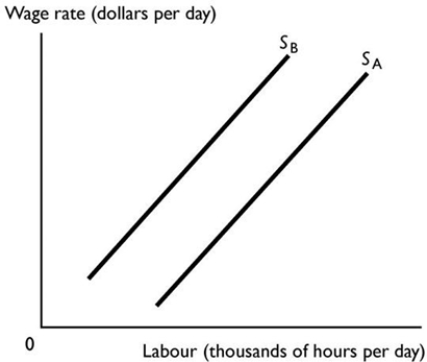
-The figure above shows the market for high- and low-skilled labour. Supply curve SB represents the supply of ________ labour because ________.
A) low-skilled; low-skilled labour must work more hours to compensate for the lower wage
B) high-skilled; firms supply more jobs for high-skilled workers
C) low-skilled; firms supply fewer jobs for low-skilled labour
D) high-skilled; these workers must receive higher pay in return for acquiring their skills
E) low-skilled; low-skilled labour has a lower value of marginal product
Correct Answer:
Verified
Q17: A Lorenz curve for income shows the
A)
Q18: Q19: Poverty for a household is defined as Q20: If the Lorenz curve for income moves Q21: The demand curve for high-skilled workers Q23: The cost of acquiring a skill accounts Q24: The rates of return on high school Q25: Discrimination by customers creates a wage differential Q26: What determines the position of the supply Q27: Which of the following is true? At![]()
A) lies
Unlock this Answer For Free Now!
View this answer and more for free by performing one of the following actions

Scan the QR code to install the App and get 2 free unlocks

Unlock quizzes for free by uploading documents