Multiple Choice
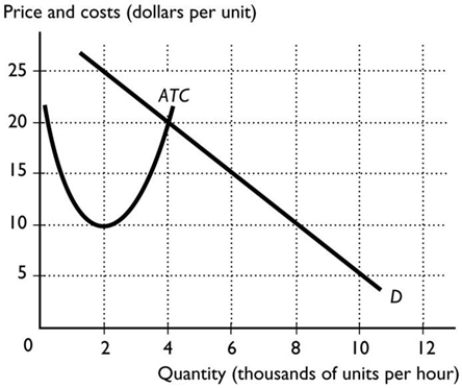
-The figure above shows the market demand curve and the ATC curve for a firm. If all firms in the market have the same ATC curve, the figure shows a ________ can profitably operate.
A) natural monopoly in which 1 firm
B) natural oligopoly in which 2 firms
C) natural oligopoly in which 5 or more firms
D) natural oligopoly in which 4 firms
E) natural oligopoly in which 3 firms
Correct Answer:
Verified
Related Questions

