Multiple Choice
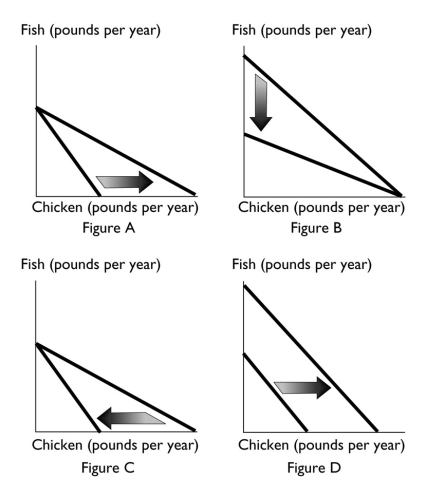
-Which of the above figures reflects an increase in the price of fish?
A) Figure A
B) Figure B
C) Figure C
D) Figure D
E) Both Figure B and Figure C
Correct Answer:
Verified
Related Questions
Q54: When the relative price of computers falls,consumption
Q55: Q56: When the price of one good changes Q57: A budget line shows the Q58: A budget line Q60: An increase in a consumer's budget Q61: The benefit that John gets from eating Unlock this Answer For Free Now! View this answer and more for free by performing one of the following actions Scan the QR code to install the App and get 2 free unlocks Unlock quizzes for free by uploading documents![]()
A) limits to
A) represents combinations of goods
A) shifts

