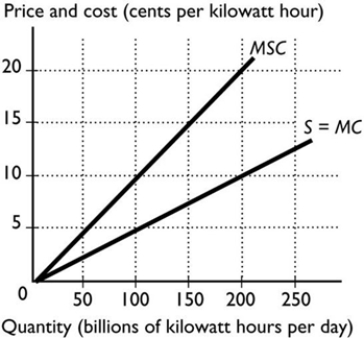
-The figure above shows the marginal social cost curve of generating electricity and the marginal private cost curve. The marginal external cost when 200 billion kilowatt hours are produced is
A) 0 cents per kilowatt hour.
B) 5 cents per kilowatt hour.
C) 20 cents per kilowatt hour.
D) 10 cents per kilowatt hour.
E) 15 cents per kilowatt hour.
Correct Answer:
Verified
Q21: If producing a good or a service
Q22: The deadweight loss associated with producing a
Q23: Q24: Q25: Q27: Q28: The basic reason that a competitive unregulated Q29: One reason why property rights help achieve Q30: If the marginal social cost of producing Q31: Unlock this Answer For Free Now! View this answer and more for free by performing one of the following actions Scan the QR code to install the App and get 2 free unlocks Unlock quizzes for free by uploading documents![]()
![]()
![]()
![]()
![]()

