Multiple Choice
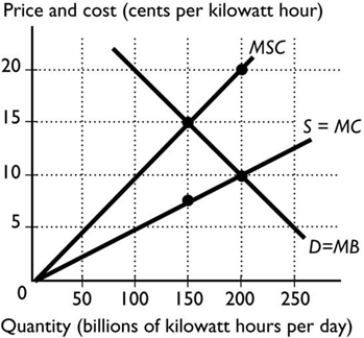
-The figure above shows the marginal social cost curve of generating electricity, the marginal private cost curve, and the demand curve. If the market is competitive and unregulated, the equilibrium price is ________ per kilowatt hour and the equilibrium quantity is ________ billion kilowatt hours per day.
A) 10 cents; 200
B) 20 cents; 100
C) 7.5 cents; 150
D) 15 cents; 150
E) 20 cents; 200
Correct Answer:
Verified
Related Questions

