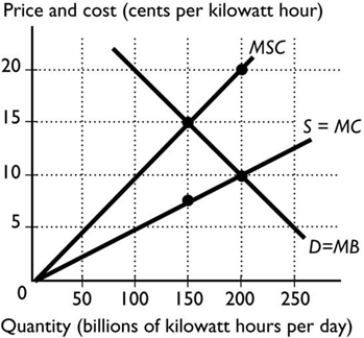
-The figure above shows the marginal social cost curve of generating electricity, the marginal private cost curve, and the demand curve. If the government imposes a pollution tax to achieve the efficient level of production, the tax equals ________ per kilowatt hour.
A) 2.5 cents
B) 0 cents
C) 15 cents
D) 7.5 cents
E) 10 cents
Correct Answer:
Verified
Q36: Q37: Q38: Q39: Q40: Legally established titles to ownership, use and Q42: Q43: Cap-and-trade refers to Q44: Which of the following is the best Q45: The Coase theorem deals with the problem Q46: Unlock this Answer For Free Now! View this answer and more for free by performing one of the following actions Scan the QR code to install the App and get 2 free unlocks Unlock quizzes for free by uploading documents![]()
![]()
![]()
![]()
![]()
A) capping emissions and issuing![]()

