Multiple Choice
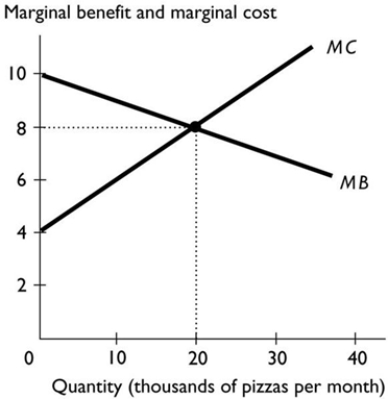
-The figure above shows the marginal benefit and marginal cost curves for pizza. In the figure, what is the efficient quantity of pizza?
A) 20,000 pizzas
B) 30,000 pizzas
C) 0 pizzas
D) 10,000 pizzas
E) The efficient quantity cannot be determined without more information.
Correct Answer:
Verified
Related Questions
Q76: The producer surplus of making and selling

