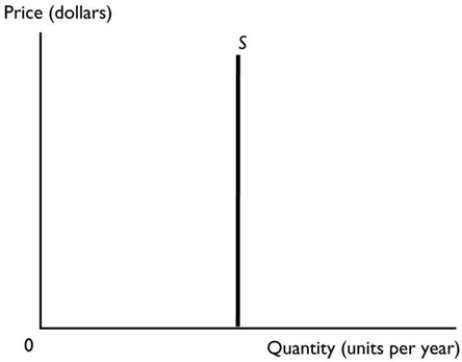
-The figure above shows the supply curve for a good with
A) an inelastic supply.
B) an elastic supply.
C) a perfectly elastic supply.
D) a unit elastic supply.
E) a perfectly inelastic supply.
Correct Answer:
Verified
Q66: When the percentage change in the quantity
Q67: Suppose the current price of barley is
Q68: If the price of timber increased by
Q69: Which of the following explains why supply
Q70: If the price of beef increased by
Q72: If the price elasticity of supply for
Q73: If the percentage change in the price
Q74: The price of one-bedroom apartments in Mildura
Unlock this Answer For Free Now!
View this answer and more for free by performing one of the following actions

Scan the QR code to install the App and get 2 free unlocks

Unlock quizzes for free by uploading documents