Multiple Choice
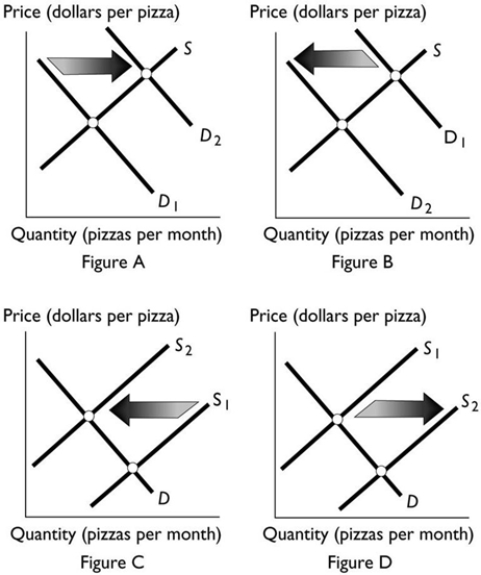 Which figure above shows the effect of a decrease in the number of pizza sellers?
A) Figure A
B) Figure B
C) Figure C
D) Figure D
E) Both Figure B and Figure C
Correct Answer:
Verified
Related Questions
Q96: If the price is below the equilibrium
Q97: Using the data in the table above,
Q98: Q99: An increase in both the equilibrium price Q100: Suppose the equilibrium price of oranges is![]()

