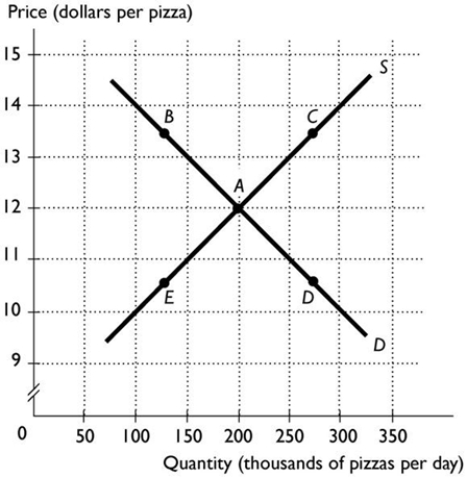
 The above figure shows the market for pizza. The market is in equilibrium when new pizza firms enter the market. What point represents the most likely new price and quantity?
A) A
B) B
C) C
D) D
E) E
Correct Answer:
Verified
Q129: Suppose the demand curve for desktop computers
Q130: When demand increases and supply decreases by
Q131: Q132: A technological improvement lowers the cost of Q133: Q135: If the demand curve for desktop computers Q136: Kiwi fruit and strawberries are substitutes for Q137: Suppose improvements in technology cause the supply Unlock this Answer For Free Now! View this answer and more for free by performing one of the following actions Scan the QR code to install the App and get 2 free unlocks Unlock quizzes for free by uploading documents![]()
![]()

