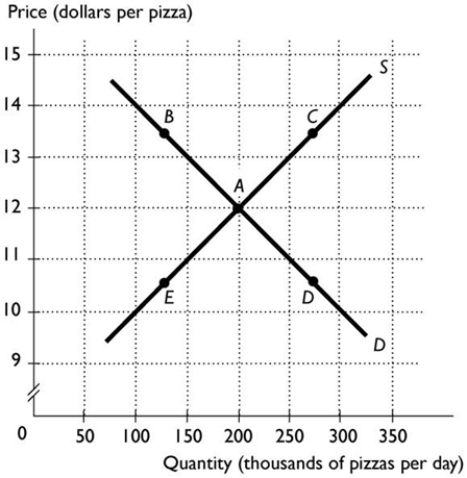
 The above figure shows the market for pizza. The market is in equilibrium. Pizza and tacos are substitutes for consumers. The price of tacos falls. What point represents the most likely new price and quantity?
A) A
B) B
C) C
D) D
E) E
Correct Answer:
Verified
Q116: Q117: When laptops were first produced, the price Q118: If good weather conditions result in a Q120: Q122: Suppose a medical study reveals new benefits Q123: A competitive market is in equilibrium. Then Q124: The number of people looking to buy Q125: If both the supply and demand curves Q126: Q223: Unlock this Answer For Free Now! View this answer and more for free by performing one of the following actions Scan the QR code to install the App and get 2 free unlocks Unlock quizzes for free by uploading documents![]()
![]()
![]()
![]()

