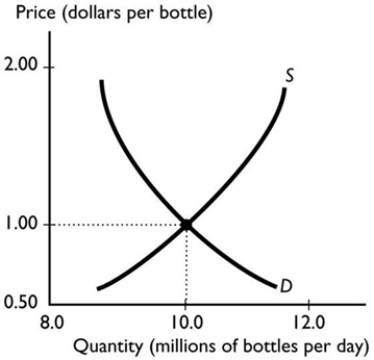
 The graph illustrates the market for bottled water. When the price exceeds the equilibrium price, the quantity demanded is ________ the quantity supplied and the price of the good will ________.
A) equal to; fall
B) greater than; fall
C) less than; fall
D) greater than; rise
E) less than; rise
Correct Answer:
Verified
Q128: If both producers and consumers believe that
Q129: Suppose the demand curve for desktop computers
Q130: When demand increases and supply decreases by
Q131: Q132: A technological improvement lowers the cost of Q134: Q135: If the demand curve for desktop computers Q136: Kiwi fruit and strawberries are substitutes for Q137: Suppose improvements in technology cause the supply Q138: Unlock this Answer For Free Now! View this answer and more for free by performing one of the following actions Scan the QR code to install the App and get 2 free unlocks Unlock quizzes for free by uploading documents![]()
![]()
![]()

