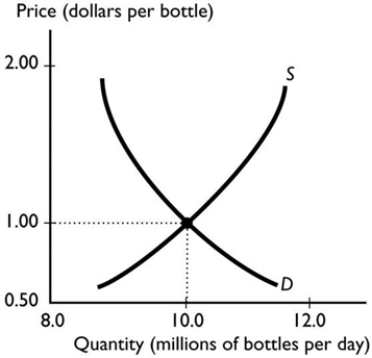
 The graph illustrates the market for bottled water. If the producers of bottled water switch to using improved technology, then the
A) quantity demanded of bottled water does not change.
B) price of bottled water rises.
C) quantity demanded of bottled water increases.
D) supply curve shifts leftward.
E) supply of bottled water decreases.
Correct Answer:
Verified
Q121: Q122: Suppose a medical study reveals new benefits Q123: A competitive market is in equilibrium. Then Q124: The number of people looking to buy Q125: If both the supply and demand curves Q127: The demand for cat food decreases while Q128: If both producers and consumers believe that Q129: Suppose the demand curve for desktop computers Q130: When demand increases and supply decreases by Q131: ![]()
![]()
Unlock this Answer For Free Now!
View this answer and more for free by performing one of the following actions

Scan the QR code to install the App and get 2 free unlocks

Unlock quizzes for free by uploading documents