Multiple Choice
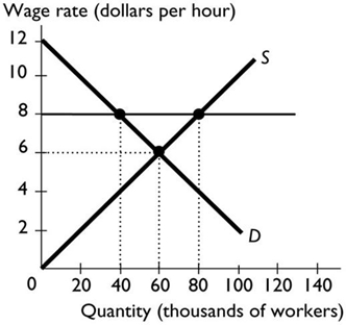
-The figure above shows the labour market in a region. For a minimum wage to change the wage rate and amount of employment, it must be
A) set at $12 per hour.
B) set above $6 an hour.
C) left to the forces of supply and demand.
D) set equal to $6 an hour.
E) set below $6 an hour.
Correct Answer:
Verified
Related Questions

