According to Figure 31.1: The Growth of Inequality: Changes in Family Income, 1969-1998, which year saw the smallest amount of income inequality in the United States? 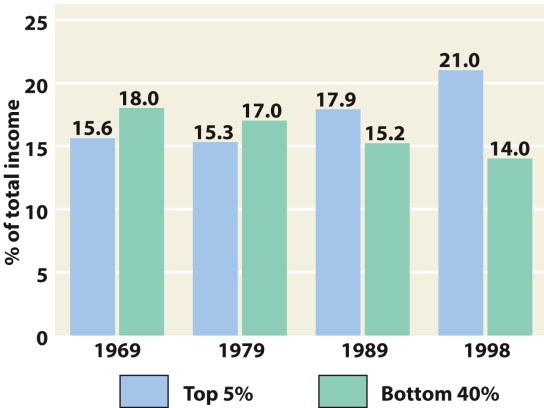
A) 1969
B) 1979
C) 1989
D) 1998
Correct Answer:
Verified
Q1: How did the Soviet Union respond to
Q3: Why did the United States intervene in
Q5: Opposition from which group led President Clinton
Q11: Why did Bill Clinton's ambitious plan for
Q12: The welfare reform measures passed during the
Q16: Why did George H.W.Bush ultimately abandon his
Q17: According to Map 31.1: Events in Eastern
Q18: What was the result of the congressional
Q20: As he worked to support his pledge
Q38: Which was the largest minority group in
Unlock this Answer For Free Now!
View this answer and more for free by performing one of the following actions

Scan the QR code to install the App and get 2 free unlocks

Unlock quizzes for free by uploading documents