The diagram below shows the demand and supply curves for refrigerators in Canada. 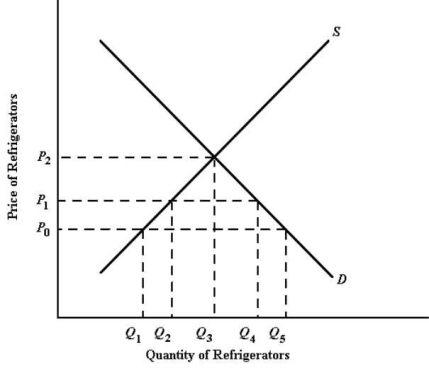 FIGURE 33-1 Refer to Figure 33-1.At the price P0,the quantity of refrigerators imported into the Canadian market is
A) Q3Q5.
B) Q2Q4.
C) Q2Q5.
D) Q2Q3.
E) Q1Q5.
Correct Answer:
Verified
Q44: The diagram below shows the domestic demand
Q45: The diagram below shows the domestic demand
Q46: The diagram below shows the domestic demand
Q47: The diagram below shows the demand and
Q48: If Canada reduces the tariff imposed on
Q50: The diagram below shows the demand and
Q51: The diagram below shows the demand and
Q52: Suppose lumber,a homogeneous product,is exported from Canada
Q53: The diagram below shows the domestic demand
Q54: Suppose a 10% tariff on all wines
Unlock this Answer For Free Now!
View this answer and more for free by performing one of the following actions

Scan the QR code to install the App and get 2 free unlocks

Unlock quizzes for free by uploading documents