The diagram below shows Robinson Crusoe's annual production possibilities boundary for the production of bananas and coconuts. 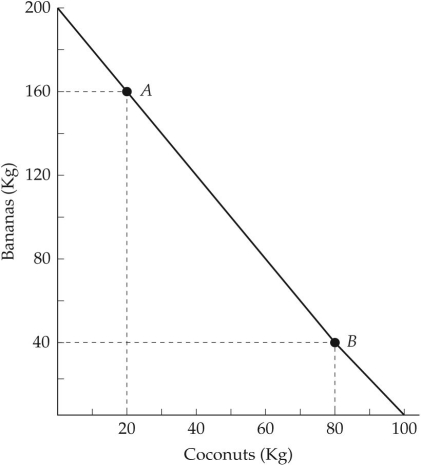 FIGURE 32-3 Refer to Figure 32-3.Starting from point A and moving to point B,Robinson Crusoe's opportunity cost of producing each additional kilogram of coconuts is
A) increasing.
B) increasing followed by decreasing.
C) constant.
D) decreasing.
E) decreasing followed by increasing.
Correct Answer:
Verified
Q66: This table shows how much cotton and
Q67: This table shows how much wine and
Q68: In addition to realizing the benefits of
Q69: When specialization according to comparative advantage also
Q70: According to David Ricardo's principle of comparative
Q72: This table shows how much cotton and
Q73: The diagram below shows Robinson Crusoe's annual
Q74: This table shows how much wine and
Q75: The diagram below shows Robinson Crusoe's annual
Q76: This table shows how much cotton and
Unlock this Answer For Free Now!
View this answer and more for free by performing one of the following actions

Scan the QR code to install the App and get 2 free unlocks

Unlock quizzes for free by uploading documents