The diagram below shows Robinson Crusoe's annual production possibilities boundary for the production of bananas and coconuts. 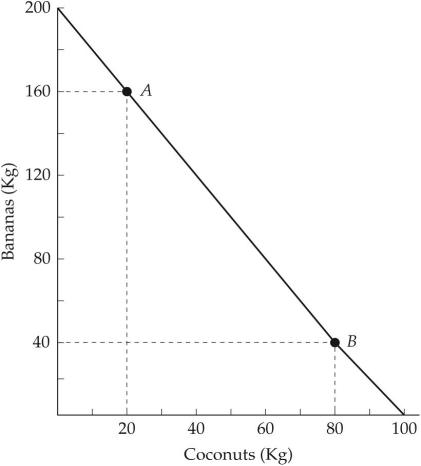 FIGURE 32-3 Refer to Figure 32-3.What is Robinson Crusoe's opportunity cost of bananas in terms of coconuts?
A) 2
B) 1
C) 1/2
D) 100
E) 200
Correct Answer:
Verified
Q73: The diagram below shows Robinson Crusoe's annual
Q74: This table shows how much wine and
Q75: The diagram below shows Robinson Crusoe's annual
Q76: This table shows how much cotton and
Q77: This table shows how much wine and
Q79: The figure below shows Arcticland's annual production
Q80: This table shows how much cotton and
Q81: International trade permits a country to
A)produce and
Q82: The diagram below shows the domestic demand
Q83: With regard to international trade,which of the
Unlock this Answer For Free Now!
View this answer and more for free by performing one of the following actions

Scan the QR code to install the App and get 2 free unlocks

Unlock quizzes for free by uploading documents