The data below provides the Actual and Structural Budget Deficits,as a percentage of real GDP,for Canada between 1999 and 2010.Note that a negative value in the table indicates a budget surplus. 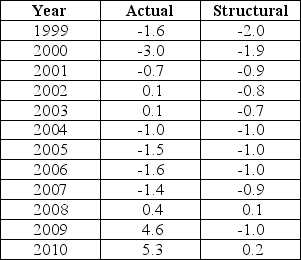 TABLE 31-2 Refer to Table 31-2.Based on the data in the table,in which of the following years was output greater than potential?
A) 1999
B) 2004
C) 2000
D) 2008
E) 2010
Correct Answer:
Verified
Q65: The data below provides the Actual and
Q66: If the economy goes into a recession,the
Q67: The diagram below shows two budget deficit
Q68: The diagram below shows two budget deficit
Q69: Consider changes in the government's debt-to-GDP ratio.Suppose
Q71: The data below provides the Actual and
Q72: Suppose the government's actual budget deficit is
Q73: Suppose the real interest rate on government
Q74: Suppose the government's debt-to-GDP ratio on January
Q75: Suppose the change in the government's debt-to-GDP
Unlock this Answer For Free Now!
View this answer and more for free by performing one of the following actions

Scan the QR code to install the App and get 2 free unlocks

Unlock quizzes for free by uploading documents