The labour market in the diagram below begins in equilibrium with a real wage of $10 and quantity employed of 1000. 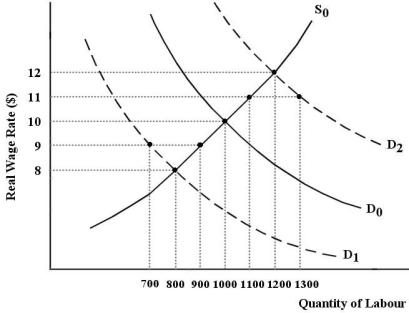 FIGURE 30-1 Refer to Figure 30-1.The economy begins with D0 and S0.Suppose there is a positive shock to the economy,which shifts the demand for labour curve to D2,and the wage rate rises to $11.The result is
A) cyclical unemployment of 200 workers.
B) excess supply of labour of 300 workers.
C) excess demand for labour of 300 workers.
D) excess supply of labour of 200 workers.
E) excess demand for labour of 200 workers.
Correct Answer:
Verified
Q51: In non-market-clearing theories of the labour market,an
Q52: "Efficiency wages" are said to exist when
Q53: The main difference between market-clearing and non-market-clearing
Q54: The labour market in the diagram below
Q55: What is a likely consequence of firms
Q57: Retaining a core group of experienced employees
Q58: The theory of "efficiency wages" provides
A)a way
Q59: Non-market-clearing theories of the labour market feature
Q60: Involuntary unemployment in a labour market is
Q61: Which of the following best describes the
Unlock this Answer For Free Now!
View this answer and more for free by performing one of the following actions

Scan the QR code to install the App and get 2 free unlocks

Unlock quizzes for free by uploading documents