The economy in the diagram below begins in long-run equilibrium at E0. 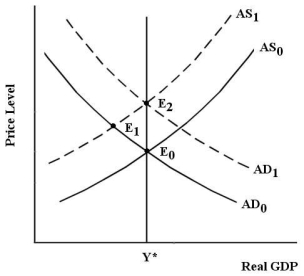 FIGURE 30-2 Refer to Figure 30-2.At E0,the unemployment rate is 5.6%.An increase in the price of raw materials shifts the AS curve to AS1 and a new short-run equilibrium is established at E1.At E1,the unemployment rate is 7%.Therefore,other things being equal,
A) the NAIRU is 7%.
B) the sum of frictional and structural unemployment is 7%.
C) cyclical unemployment is 1.4%.
D) the economy is at full employment.
E) cyclical unemployment is negative.
Correct Answer:
Verified
Q63: Other things being equal,when changes in technology
Q64: An unemployed worker can be identified as
Q65: An unemployed worker can be identified as
Q66: Technological changes over time have caused workers
Q67: An unemployed worker can be identified as
Q69: The kind of unemployment that results when
Q70: Suppose a free-trade agreement with Central America
Q71: Suppose the NAIRU in some country in
Q72: The normal turnover of workers and the
Q73: Which of the following statements about frictional
Unlock this Answer For Free Now!
View this answer and more for free by performing one of the following actions

Scan the QR code to install the App and get 2 free unlocks

Unlock quizzes for free by uploading documents