The table below shows real GDP,potential GDP and the unemployment rate for a hypothetical economy. 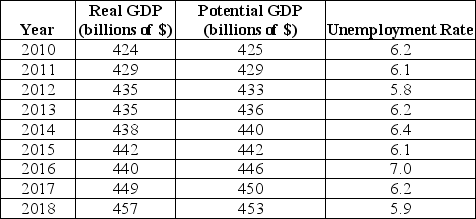 TABLE 30-3 Refer to Table 30-3.The variations in the unemployment rate between 2007 and 2015 are likely due to variations in
A) the NAIRU.
B) frictional unemployment.
C) structural unemployment.
D) potential output.
E) the output gap.
Correct Answer:
Verified
Q87: If there were an increase in the
Q88: Unemployment rates among workers in the 15-24
Q89: According to 2018 data,unemployment rates for females
Q90: The ongoing process of globalization of the
Q91: Suppose that unemployed workers searching to replace
Q93: The table below shows real GDP,potential GDP
Q94: In some European countries,labour-market policies make it
Q95: An increase in the rate of aggregate
Q96: Which of the following statements best explains
Q97: As Canada continues to become more integrated
Unlock this Answer For Free Now!
View this answer and more for free by performing one of the following actions

Scan the QR code to install the App and get 2 free unlocks

Unlock quizzes for free by uploading documents