The table below shows the percentage of the labour force accounted for by males and females over a two-decade period.Assume that real GDP is equal to potential in each of the given years. % of Labour Force 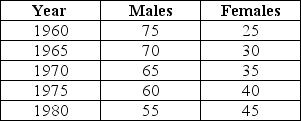 TABLE 30-4
Refer to Table 30-4.Suppose that for each year listed the unemployment rate among males is 5% while it is 7% among females.Which of the following statements correctly describes the change in the NAIRU in this economy between 1960 and 1980?
A) Since females account for a smaller percentage of the labour force in all years,the NAIRU is decreasing over time.
B) The NAIRU remains constant between 1960 and 1980 because the unemployment rates for males and females remain constant.
C) Since females have a higher unemployment rate,the NAIRU increases over time as the female share in the labour force increases.
D) Since real GDP is equal to potential GDP in all years,cyclical unemployment is equal to zero,and therefore the NAIRU does not change.
E) Since males have a lower unemployment rate,and they make up a larger percentage of the labour force,the NAIRU is decreasing over time.
Correct Answer:
Verified
Q107: Suppose the Canadian government implements a new
Q108: The economy in the diagram below begins
Q109: Which of the following would be the
Q110: The table below shows the percentage of
Q111: The table below shows the percentage of
Q113: Theory suggests that frictional unemployment in Canada
Q114: The economy in the diagram below begins
Q115: Which of the following policies could the
Q116: Which of the following best explains why
Q117: The table below shows the percentage of
Unlock this Answer For Free Now!
View this answer and more for free by performing one of the following actions

Scan the QR code to install the App and get 2 free unlocks

Unlock quizzes for free by uploading documents