The diagram below shows alternate paths for two hypothetical economies,each starting with GDP of $1 billion.Assume that Area 1 is equal to Area 2. 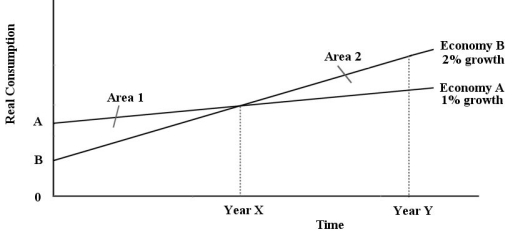 FIGURE 25-1 Refer to Figure 25-1.Which of the following costs of economic growth are reflected in this diagram?
A) the sacrifice of current consumption
B) lower real interest rate
C) environmental degradation
D) resource exhaustion
E) national saving
Correct Answer:
Verified
Q20: The theory of economic growth concentrates on
Q21: Which of the following is a benefit
Q22: Consider a closed economy with real GDP
Q23: Economic growth is often associated with structural
Q24: The four major determinants of economic growth
Q26: What is the main reason that alleviation
Q27: Which of the following is a cost
Q28: The table below shows aggregate values for
Q29: Which of the following equations is a
Q30: Long-run economic growth can help alleviate the
Unlock this Answer For Free Now!
View this answer and more for free by performing one of the following actions

Scan the QR code to install the App and get 2 free unlocks

Unlock quizzes for free by uploading documents