The diagram below shows an AD/AS model for a hypothetical economy.The economy begins in long-run equilibrium at point A. 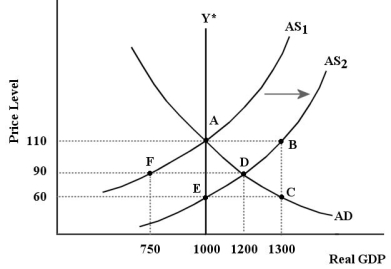 FIGURE 24-4 Refer to Figure 24-4.After the positive aggregate supply shock shown in the diagram,which of the following would shift the AS curve leftward during the economy's adjustment process?
A) an increase in factor supplies
B) an increase in the unemployment rate
C) a decrease in wages and other factor prices
D) an increase in labour productivity
E) an increase in wages and other factor prices
Correct Answer:
Verified
Q77: The diagram below shows an AD/AS model
Q78: Suppose Canada's economy is in a long-run
Q79: What is meant by the term "stagflation"?
A)the
Q80: Consider an economy with a relatively steep
Q81: Consider the AD/AS model after factor prices
Q83: The curve that is sometimes called the
Q84: Consider the AD/AS model.In the long run,after
Q85: Suppose the economy begins in a long-run
Unlock this Answer For Free Now!
View this answer and more for free by performing one of the following actions

Scan the QR code to install the App and get 2 free unlocks

Unlock quizzes for free by uploading documents