Multiple Choice
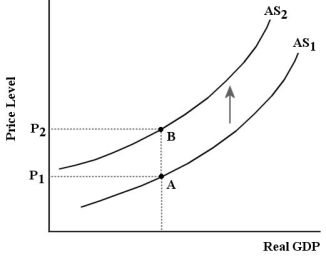 FIGURE 23-2 Refer to Figure 23-2.The shift from AS1 to AS2 shown in the diagram is referred to as a(n)
A) increase in aggregate supply.
B) increase in unit costs.
C) negative aggregate supply shock.
D) positive aggregate supply shock.
E) decrease in unit costs.
Correct Answer:
Verified
Related Questions
Q77: Which of the following could cause the
Q78: The aggregate supply curve relates the price
Q79: Which of the following explains why we
Q80: Consider the basic AD/AS model.If there is
Q81: The aggregate supply curve is usually assumed
Unlock this Answer For Free Now!
View this answer and more for free by performing one of the following actions

Scan the QR code to install the App and get 2 free unlocks

Unlock quizzes for free by uploading documents