The diagrams below show the import,export,and net export functions for an economy. 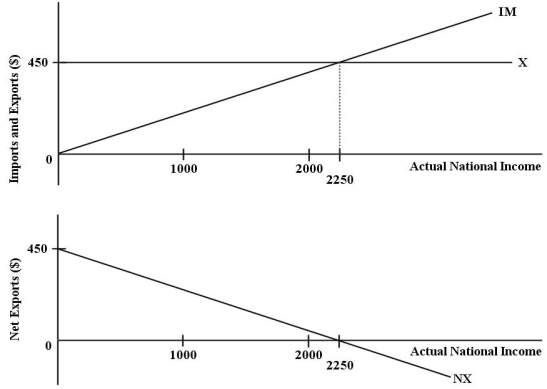 FIGURE 22-1 Refer to Figure 22-1.The function for desired imports for this economy can be expressed as
A) NX = 450 - Y.
B) IM = 450 - 0.5(Y) .
C) NX = 0.5(Y) .
D) IM = 0.5(Y) .
E) IM = 0.2(Y) .
Correct Answer:
Verified
Q19: The G and T components in the
Q20: Why are government expenditures such as Old
Q21: A decrease in domestic national income will
Q22: The net export (NX)function crosses the horizontal
Q23: A fall in the Canadian-dollar price of
Q25: A rise in domestic prices relative to
Q26: Consider the net export function.Suppose exports are
Q27: Which of the following can cause a
Q28: A fall in domestic prices relative to
Q29: In a simple macro model,it is generally
Unlock this Answer For Free Now!
View this answer and more for free by performing one of the following actions

Scan the QR code to install the App and get 2 free unlocks

Unlock quizzes for free by uploading documents