The table below shows national income and imports.The level of exports is fixed at $300.All figures in the table and in the questions are in millions of dollars. 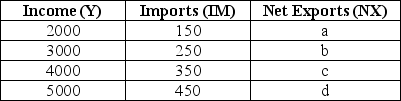 TABLE 22-1 Refer to Table 22-1.What is the marginal propensity to import?
A) 0.01
B) 0.10
C) 1.0
D) 10.0
E) not enough data to determine
Correct Answer:
Verified
Q41: The diagrams below show the import,export,and net
Q42: The table below shows national income and
Q43: The AE function for an open economy
Q44: Consider the general form of the consumption
Q45: When compared to a simple macroeconomic model
Q47: Consider a simple macro model with a
Q48: The table below shows national income and
Q49: Consider a consumption function in a simple
Q50: The diagrams below show the import,export,and net
Q51: The table below shows national income and
Unlock this Answer For Free Now!
View this answer and more for free by performing one of the following actions

Scan the QR code to install the App and get 2 free unlocks

Unlock quizzes for free by uploading documents