The diagram below shows desired aggregate expenditure for a hypothetical economy.Assume the following features of this economy: • marginal propensity to consume (mpc) = 0.80
• net tax rate (t) = 0.15
• no foreign trade
• fixed price level
• all expenditure and income figures are in billions of dollars. 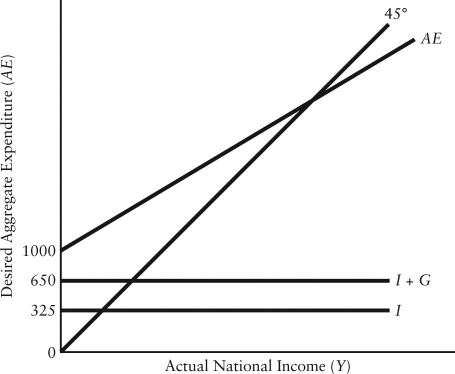 FIGURE 22-3
Refer to Figure 22-3.Which of the following equations describes the aggregate expenditure function for this economy?
A) AE = 1000 + (0.68) Y
B) AE = 1000 + (0.80) 
C) AE = 1000 + (0.80) Y + 0.15 YD
D) AE = 1975 + (0.68) Y
E) AE = 1975 + (0.65) Y
Correct Answer:
Verified
Q72: The diagram below shows desired aggregate expenditure
Q73: Q74: The diagram below shows desired aggregate expenditure Q75: The diagram below shows desired aggregate expenditure Q76: The diagram below shows desired aggregate expenditure Q78: The diagram below shows desired aggregate expenditure Q79: The diagram below shows desired aggregate expenditure Q80: The diagram below shows desired aggregate expenditure Q81: Consider a simple macro model with a Q82: The diagram below shows desired aggregate expenditure![]()
Unlock this Answer For Free Now!
View this answer and more for free by performing one of the following actions

Scan the QR code to install the App and get 2 free unlocks

Unlock quizzes for free by uploading documents