The diagram below shows desired aggregate expenditure for a hypothetical economy.Assume the following features of this economy: • marginal propensity to consume (mpc) = 0.80
• net tax rate (t) = 0.15
• no foreign trade
• fixed price level
• all expenditure and income figures are in billions of dollars. 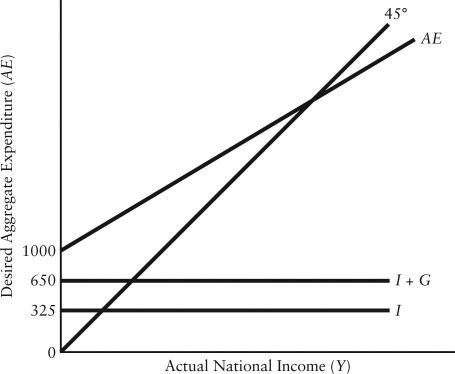 FIGURE 22-3
Refer to Figure 22-3.What is the equilibrium national income in this economy?
A) $1470.59
B) $3125.00
C) $1975.00
D) $5000.00
E) $6171.87
Correct Answer:
Verified
Q77: The diagram below shows desired aggregate expenditure
Q78: The diagram below shows desired aggregate expenditure
Q79: The diagram below shows desired aggregate expenditure
Q80: The diagram below shows desired aggregate expenditure
Q81: Consider a simple macro model with a
Q83: In an open economy with government and
Q84: In a simple macro model with a
Q85: Consider a simple macro model with a
Q86: In an open economy with government and
Q87: The diagram below shows desired aggregate expenditure
Unlock this Answer For Free Now!
View this answer and more for free by performing one of the following actions

Scan the QR code to install the App and get 2 free unlocks

Unlock quizzes for free by uploading documents